Network Pulse Barometer (NPB)
Increasingly managers need to lead and support a diverse range of constituencies, communities, departments, functions, teams and resources distributed geographically and often without formal authority or power. They have powerful technologies available to them to establish the conditions for success (eg Performance Scorecards, Service Level Agreements, Accountability Mapping etc) to support network performance, but very limited tools to help them understand just how effectively networks are operating, where support or active intervention is required, which type of intervention is most appropriate and the impact of any action taken.
Just as the Relationship Pulse Barometer (RPB) can assist in evolving the relationships between two teams, the Network Pulse Barometer (NPB) can assist in evolving the effectiveness of a network of relationships. The NPB and associated design and positioning process helps :
-
Senior Managers clarify the critical relationships that drive success within their sphere of influence or control,
-
Define the characteristics that underpin the success of critical relationships within each network and that ensure each parties critical needs and expectations are met. These characteristics may differ from relationship-to-relationship and team-to-team (i.e. what each team needs and receives from the other) and for the same team involved in different relationships,
-
Create relationship ownership at all levels and engage all leaders (and employees if needed) in the improvement process,
-
Provide information that may be taken to established (or new) forums/meetings to explore issues, trends and improvement opportunities,
-
Monitor the health of critical relationships and manage the key characteristics that drive relationship health (lead indicators),
-
Identify areas requiring improvement and support,
-
Stimulate energy, interaction and dialogue between team leaders and teams through which improvement plans and commitments can be formulated.
An Effective Approach
The tools effectiveness is underpinned on its ability to:
-
Help managers manage neetworks
-
Provide a high level view of the network with drill down capability to successive levels (relationship, characteristics and means, characteristic responses etc)
-
Be designed and configured and owned by the managers and teams in the network to assist them address their own issues,
-
Be simple to use and interpret,
-
Minimise effort required from respondents and provide real time feedback,
-
Assure respondent confidentiality and thereby increase employee participation,
-
Effectively tap into issues with high workforce face validity where high energy for change exists,
-
Flex and address different issues as the network evolves.
Key Features
-
A powerful tool that provides a clear and credible high level view of network health
-
Generates energy for change and facilitates dialogue between leaders
-
Flags issues and starts focused conversations around key drivers of network effectiveness,
-
Results presented in dashboard format (eg traffic light) to readily identify strengths and areas for improvement with drill down functionality to explore and issues and trends,
-
Trending capability helps monitor the effectiveness of actions taken which builds confidence and network management capability
-
Minimal respondent effort with no behind the scenes administration effort,
-
Simple and user friendly questions and data format; immediate feedback,
-
Information owned by Line Managers/Workgroup promoting localised accountability to act and multiple improvement initiatives
-
Web browser based ensuring that there is only one version of the truth,
-
Simple graphs used to promote intuitive understanding,
-
May include security provisions to restrict access,
-
Questions/lines of enquiry can be readily modified over time as focus shifts to new issues,
-
Can be used in conjunction with more detailed analytical tools and diagnostics administered over longer timeframes.
An Example
Consider the example of Engineering Manager of a large Manufacturing firm. Managers in these roles typically have many work groups involved in providing specialist services to support the achievement of departmental business outcomes (eg. safety, asset availability, asset reliability, asset integrity, cost, labour productivity, labour motivation etc). Through expert anaysis and/or focus group discussions, critical technical relationships that both underpin the achievement of these outcomes and are appropriate for the networks particular stage of development are identified and subsequently verified with stakeholder and customer groups. The key characteristics that underpin the effectiveness of each of these critical relationship are then defined and relationship pulse barometers designed and implemented to capture the necessary information. Relationship Pulse Barometer results are then aggregated to provide a 'high level' view of network health.(see illustrative example below). Formats can be customised to meet client specific needs and data exported to access, excel, SQL etc if required.
Traffic light responses (arrow colours) are typically calculated on the basis of :
- the extent to which the needs of each customer in the relationship are met (70%)
- the level of alignment between service provider and service recipient perceptions of the relationship (30%)
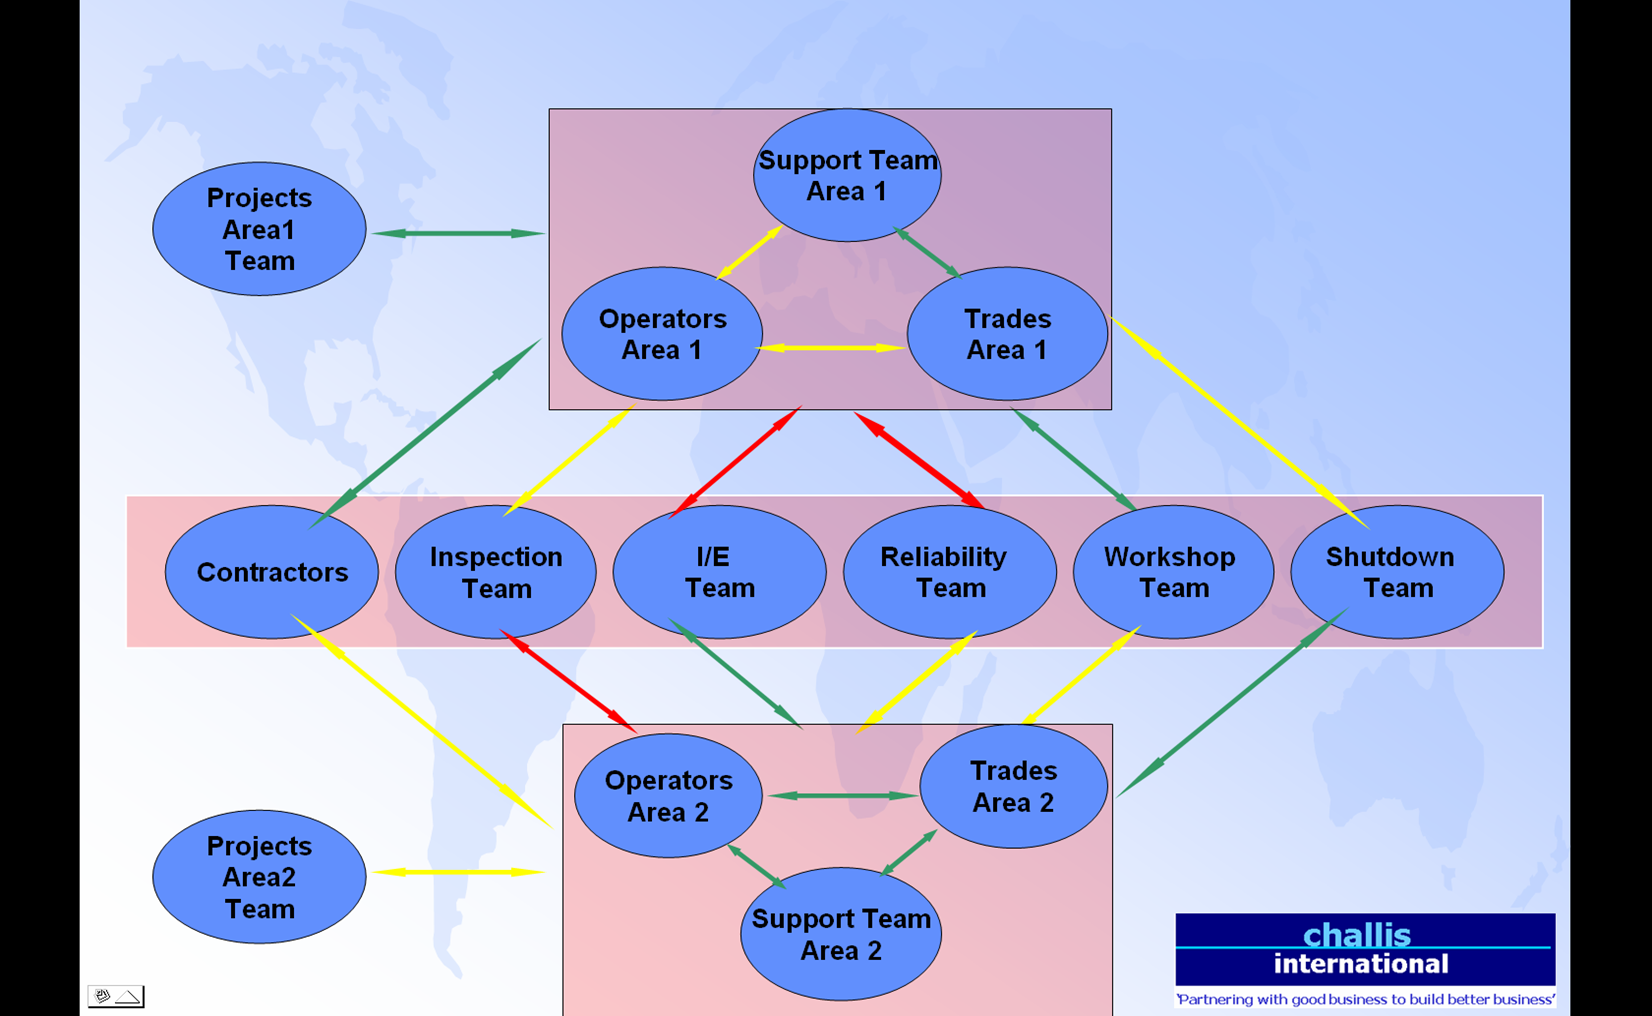
Network Pulse Barometer - Top Level Indicative Response Format
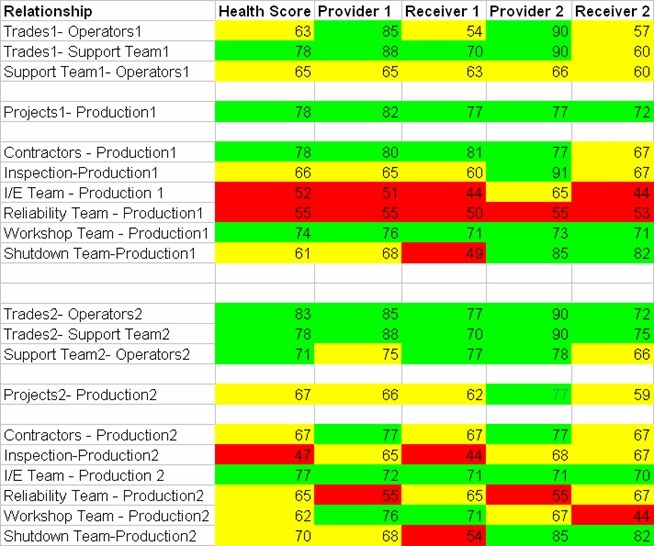
Network Pulse Barometer - Network Response Scores
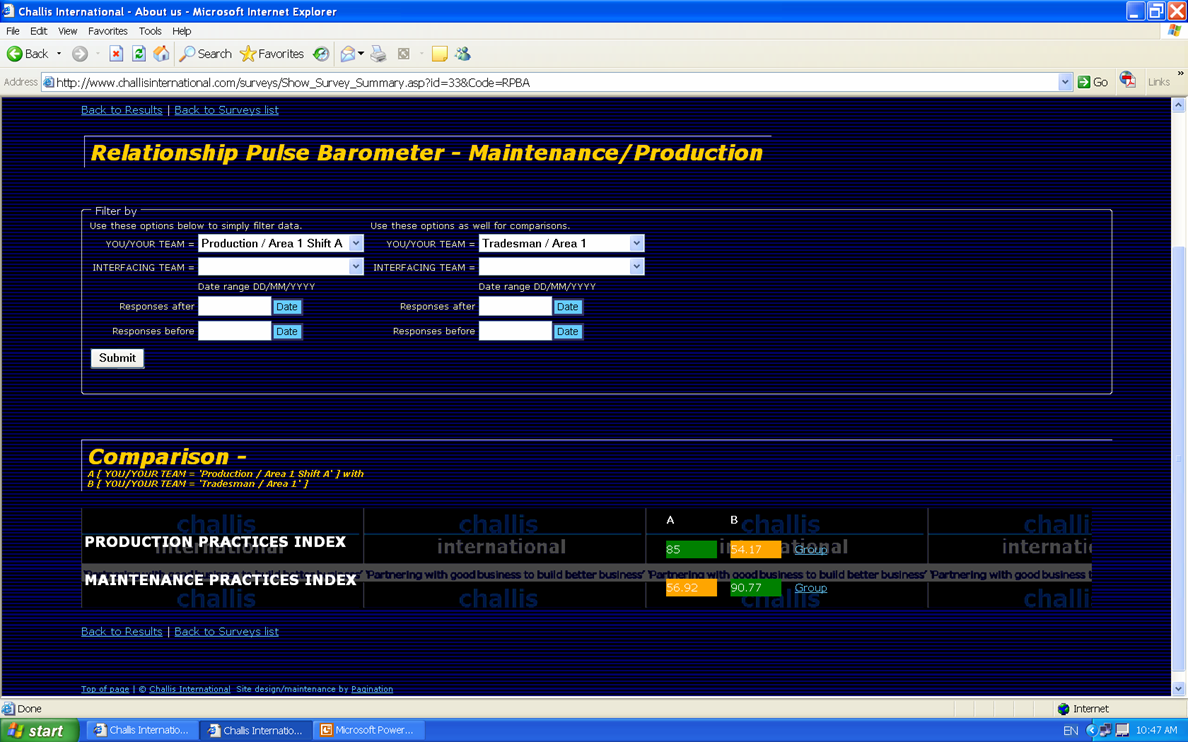 
Network Pulse Barometer - Drilldown Level 1 Indicative Relationship Results Format
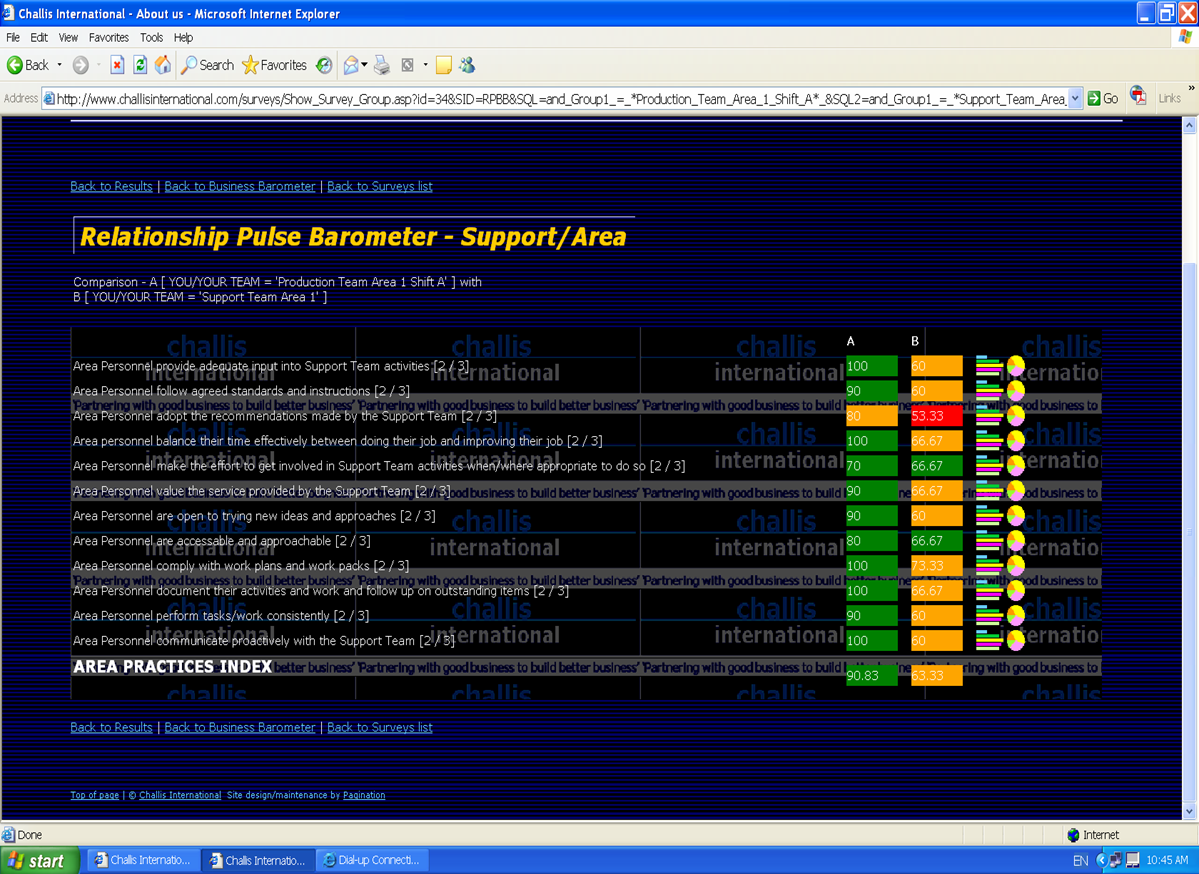
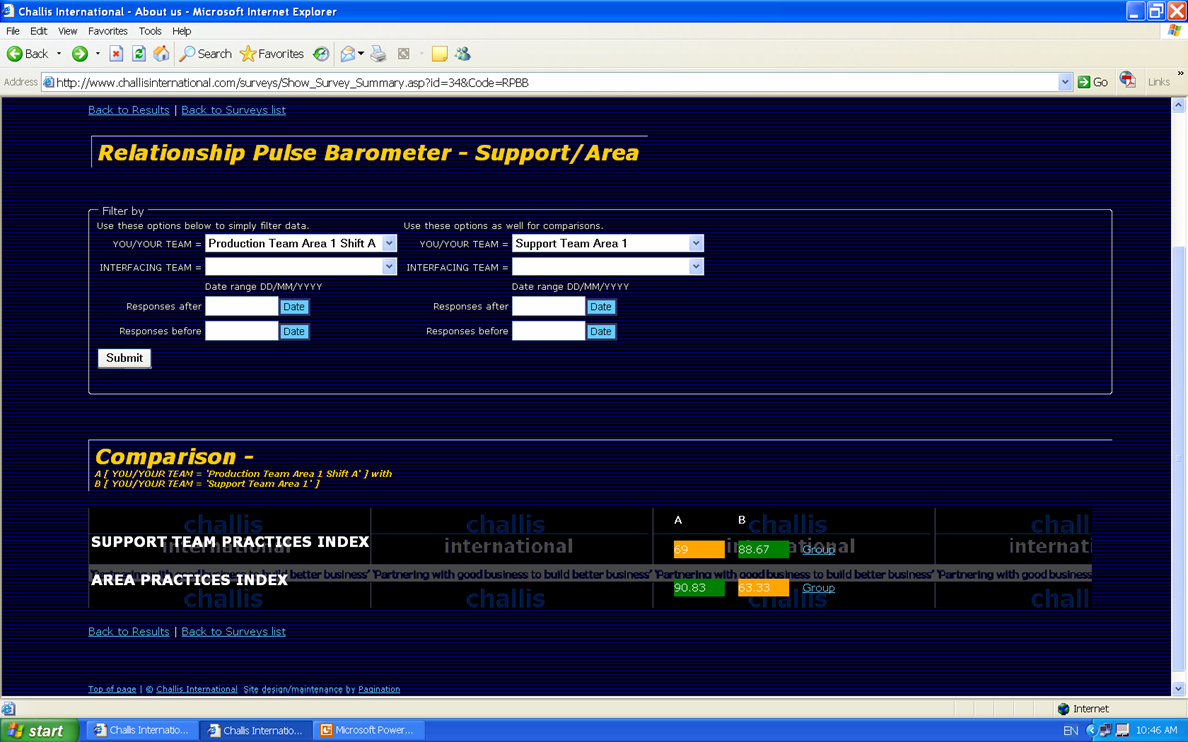
Network Pulse Barometer - Drilldown Level 2 Indicative Question Results Format
Want to know more about the Network Pulse Barometer, please contact us
|